

December 13, 2016
Current Status of Renewable Energy in Japan
Keywords: Renewable Energy
Japan was four days late to ratify the Paris Agreement, which meant that its name was not included in the list of participating countries when the agreement went into effect on November 4, 2016. The nation now faces some extra scrutiny from global society on how we tackle the issue of climate change.
Domestically, various problems related to the current power system became evident after the Great East Japan Earthquake in 2011. In response, the government is implementing power system reforms, including the complete deregulation of the retail electricity market. In our newsletters JFS has been covering the expectations and challenges for the growth of renewable energy, as well as related trends in Japan.
Renewable Energy Hopes and Hurdles Amid Full Liberalization of Japan's Electricity Market
Energy Innovation Strategy to Aim at Strong Economy and CO2 Reduction
The Challenges Facing Full-Scale Renewable Energy Development and Expectations of Electricity System Reform (Part 1)
The Challenges Facing Full-Scale Renewable Energy Development and Expectations of Electricity System Reform (Part 2)
Local Governments in Japan are Entering Power Retail Business as Country Shifts to Locally Produced Renewable Energy
New Power Companies Soar in Japan in 2014, Increase of 1.8 times from 2013
JFS has also reported on many positive trends for the expansion of renewable energy, as can be seen in the nation's long-term initiatives and individual local efforts.
Japan's New Energy Strategies: Long-Term Initiatives toward 2030 and 2050 to be Conducted by Ministries
MOE Forecasts 33% Renewables by 2030, Nuclear Plants Not Prerequisite for Energy Mix
Renewable Energy on the Rise in Japan: 100 Self-sufficient Municipalities, Oita Largest Prefectural Supplier by Self-sufficiency Ratio
Small City Wants to Become 'Big Experimental City' with New Pilot Programs
Minamisoma Releases Non-Nuclear Power Declaration, Targeting 64% Self-Supplied Power by 2020
Tokyo Plans to Increase Renewable Energy Ratio to 20% by 2024
Nagano Becomes 70% Energy Self-Sufficient, Targeting Future Happiness
Today, we updated the data on the "Current Status on Renewable Energy in Japan" webpage to fiscal 2015 data, in which we inform you on the current status of domestic renewable energy.
The following table shows estimated domestic energy generation by each renewable source and its percentage share of total power generation* in Japan, and the graph shows trends in renewable energy generation capacities.
*Total Power Generation in Japan: renewable energy generation (estimated in the "Renewables Japan Status" report) added to power generation, including major electric power utilities, other electric power producers, and in-house power generation (based on "Energy Data and Modeling Center [EDMC)] data" and the "Statistical Handbook of the Japan Electric Association").
| Type of Renewable Energy | Estimated Annual Power Generation Capacity(GWh) | Share of Total (%) |
| Solar photovoltaic (PV) | 34,085 | 3.31% |
| Wind | 5,381 | 0.52% |
| Geothermal | 3,115 | 0.30% |
| Small-scale hydropower | 17,777 | 1.73% |
| Biomass | 16,395 | 1.59% |
| Total | 76,205 | 7.41% |
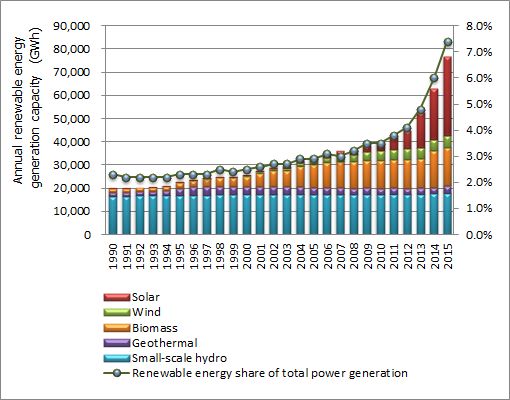
Trends in annual renewable energy generation
The above figures were calculated based on the following:
- Photovoltaic: For fiscal 2015, household generated power (30% assumed to be consumed by household) is added to figures from Electric Power Statistics. From fiscal 2012, FIT facilities' startup capacities are used. Until fiscal 2011, the amount was calculated based on a 12% utilization rate of cumulative capacity derived from the Japan Photovoltaic Energy Association's (JPEA) domestic shipments data.
- Wind: From fiscal 2012, figures from the "Statistical Handbook" or Electric Power Statistics were used. From 2003 to 2011, the amount is power supplied under the Renewable Portfolio Standard (RPS). Before 2002, the amount is estimated based on a 20% utilization rate of total capacity.
- Geothermal: From fiscal 2012, figures from the "Statistical Handbook" were used. Before fiscal 2011, actual data from the "Current Status and Trend in Geothermal Power" published by the Thermal and Nuclear Power Engineers Society were used.
- Small-ScaleHydropower: Calculated based on a 61% utilization rate of total capacity of facilities listed in the "Hydropower Stations Database" published by the Japan Electric Power Civil Engineering Association. Included power stations are conduit-type RPS facilities that are either run-of-river type or with a reservoir with maximum generation capacity of up to 10,000 kilowatts.
- Biomass: From fiscal 2014 onward, figures are from the Electric Power Statistics. For 2012 and 2013, figures are the FIT facility startup capacities. Up to fiscal 2011, calculated based on a 70% utilization rate of total capacity, assuming that 60% of fuel is biomass. Included power stations were RPS facilities with a biomass ratio of about 60 or greater.
The graph below shows overall domestic energy generation in FY2015, by source.
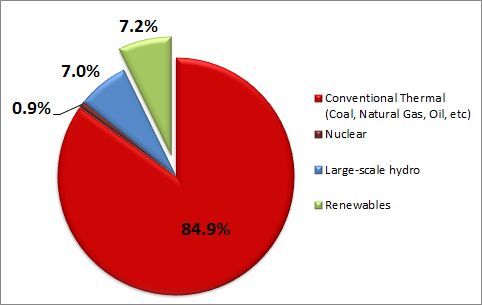
Energy generation, by source (2015)
Produced in collaboration with the Institute for Sustainable Energy Policies (ISEP):
http://www.isep.or.jp/en/
Reference:
Renewables 2016 Japan Status Report
Go to Current Status of Renewable Energy in Japan (2015)
Go to Current Status of Renewable Energy in Japan (2014)
Go to Current Status of Renewable Energy in Japan (2011)
Go to Current Status of Renewable Energy in Japan (2010)
Related
"JFS Newsletter"
- 'Yumekaze' Wind Turbine Project Connects Metro Consumers and Regional Producers: Seikatsu Club Consumers' Co-operative
- Shaping Japan's Energy toward 2050 Participating in the Round Table for Studying Energy Situations
- Nishiawakura's Initiative for 100% Energy Self-Sufficiency, and a Municipal ICO Scheme
- Actions Toward 100% Renewable Energy in Japan
- Sustainable Community Building in Shimokawa: Recycling-Oriented Forest Management Enabling Permanent Use of Forest Resources
Related
"Popular Articles"
- Current Status of Renewable Energy in Japan (2015)
- Offshore Wind Farm Withstands Great East Japan Earthquake and Tsunami
- Current Status of Renewable Energy in Japan (2014)
- Geothermal Power: Japan Has World's Third Largest Geothermal Reserves, 60 Percent of Which Can Be Developed
- Tokyo Plans to Increase Renewable Energy Ratio to 20% by 2024
![]()

Some rights reserved. This work is licensed under a Creative Commons Attribution-NonCommercial-ShareAlike 3.0 License.