

December 25, 2014
Current Status of Renewable Energy in Japan (2014)
Keywords: Renewable Energy
Since the introduction of the feed-in tariff (FIT) scheme in July 2012, renewable energy in Japan has undergone great changes. We, Japan for Sustainability (JFS), have continued to post the latest on the status of renewable energy in Japan through our newsletters.
JFS Newsletters:
- Japan's Energy Situation after the Great East Japan Earthquake (February 2013)
- Recent Trends in Nuclear Energy Policy Issues in Japan (June 2013)
- Update: Recent Developments in Nuclear Energy Policy Issues in Japan (October 2013)
- Renewable Energy in Japan -- Current Trends Show Promise and Opportunities (November 2013)
On this page, we will provide information on the current status of renewable energy in Japan, based on objective data.
The figures below illustrate the estimated amount of renewable power generation, by type and by proportion of total power generated in Japan, and the changes in renewable power generation over time.
*Total Power Generation in Japan: renewable energy generation (estimated in the "Renewables Japan Status Report 2014") added to power generation including major electric power utilities, other electric power producers, and in-house power generation (based on "Energy Data and Modeling Center (EDMC) data" and the "Statistical Handbook of the Japan Electric Association").
| Type of Renewable Energy | Estimated Annual Power Generation (GWh) | Proportion of Total (%) |
| Solar Photovoltaic | 7,635 | 0.69% |
| Wind | 4,838 | 0.44% |
| Geothermal | 2,609 | 0.24% |
| Small-Scale Hydropower | 17,401 | 1.58% |
| Biomass | 12,186 | 1.11% |
| Total | 44,670 | 4.1% |
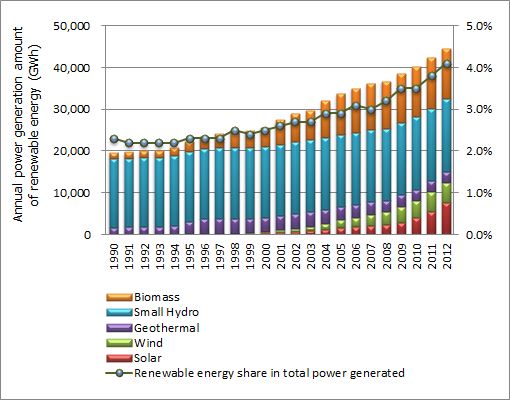
Changes in annual power generation of renewable energy
The above figures were calculated based on the following:
- Solar photovoltaic: In 2012, power plant capacity at the start of FIT operation was used to estimate total capacity; until 2011, the capacity was calculated based on a 12% utilization rate of total capacity, with the Japan Photovoltaic Energy Association (JPEA) domestic shipments used to estimate total capacity.
- Wind: In 2012, figures from the "Statistical Handbook" were used. From 2003-2011, the supply based on the Renewable Portfolio Standard (RPS) was used. Before 2002, the amount was calculated based on a 20% utilization rate of total capacity.
- Geothermal: In 2012, figures from the "Statistical Handbook" were used. Up to 2011, figures from the "Current Status and Trends in Geothermal Power," published by the Thermal and Nuclear Power Engineering Society, were used.
- Micro-Hydropower: Calculated based on a 61% utilization rate of total capacity; facilities included come from the "Hydropower Stations Database," published by the Japan Electric Power Civil Engineering Association. Included power stations are the conduit/run-of-river type and pondage type stations with maximum generation capacity of up to 10,000 kilowatts, and RPS eligible facilities.
- Biomass: Calculated based on a 70% utilization rate of total capacity, assuming that 60% of fuel is biomass. Included power stations were RPS eligible facilities with a biomass ratio of about 60% or greater.
The graph below shows proportions of overall domestic energy generation in FY2012, by type
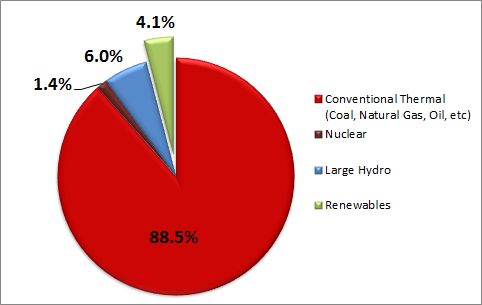
Proportions of Energy Generation, by Type
Produced in collaboration with the Institute for Sustainable Energy Policies (ISEP): http://www.isep.or.jp/en/
References:
- Renewables Japan Status Report 2014 (Japanese):
http://www.isep.or.jp/jsr2014
Related
"JFS Newsletter"
- 'Yumekaze' Wind Turbine Project Connects Metro Consumers and Regional Producers: Seikatsu Club Consumers' Co-operative
- Shaping Japan's Energy toward 2050 Participating in the Round Table for Studying Energy Situations
- Nishiawakura's Initiative for 100% Energy Self-Sufficiency, and a Municipal ICO Scheme
- Actions Toward 100% Renewable Energy in Japan
- Sustainable Community Building in Shimokawa: Recycling-Oriented Forest Management Enabling Permanent Use of Forest Resources
Related
"Popular Articles"
- Current Status of Renewable Energy in Japan (2015)
- Offshore Wind Farm Withstands Great East Japan Earthquake and Tsunami
- Current Status of Renewable Energy in Japan (2014)
- Geothermal Power: Japan Has World's Third Largest Geothermal Reserves, 60 Percent of Which Can Be Developed
- Tokyo Plans to Increase Renewable Energy Ratio to 20% by 2024
![]()

Some rights reserved. This work is licensed under a Creative Commons Attribution-NonCommercial-ShareAlike 3.0 License.