

July 22, 2018
ISEP Releases Web Page which Visualizes Renewable Energy Supply and Demand
Keywords: Energy Policy Renewable Energy
Institute for Sustainable Energy Policies (ISEP), a nonprofit organization, released on February 14, 2018, a web page featuring the ISEP Energy Chart, which visualizes the state of domestic supply and demand of electricity and energy.
ISEP makes policy proposals aimed at creating a sustainable society with renewable energy at the core. The web page, therefore, also focuses on renewable sources of electricity and heat.
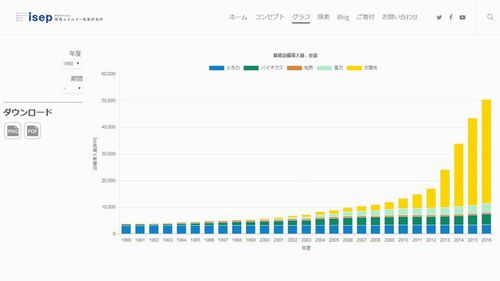
Detailed data covering energy supply and demand is rarely disclosed. In order to ascertain the spread of renewable energy in a timely manner, visualizing the data was one of the major issues to be tackled. Following the deregulation of the electricity market in Japan, ten general electricity transmission and distribution companies have been disclosing supply and demand data for their distribution areas on an hourly basis since April 2016.
ISEP established the ISEP Energy Chart for the broader public, using the knowledge and information accumulated by the institute itself as well as the newly disclosed data.
The Energy Chart is designed to show graphs for a selected period of the trends in power generation capacity and in the energy mix, as well as the total installed capacity of renewable energy-generating and heat-supplying facilities. The graphs are available for download as images or as PDF files. The Energy Chart allows a user to select a specific region and period, and has the function of displaying the maximum and minimum capacity of renewable energy generation for the selected region and period.
The web page is published under the creative commons license, meaning that if credit is given to ISEP, downloaded graphs may be freely used for the purpose of education, research or business. In addition, use of the graphs is free of charge.
Related
"JFS Newsletter"
- 'Yumekaze' Wind Turbine Project Connects Metro Consumers and Regional Producers: Seikatsu Club Consumers' Co-operative
- Shaping Japan's Energy toward 2050 Participating in the Round Table for Studying Energy Situations
- Nishiawakura's Initiative for 100% Energy Self-Sufficiency, and a Municipal ICO Scheme
- Actions Toward 100% Renewable Energy in Japan
- Sustainable Community Building in Shimokawa: Recycling-Oriented Forest Management Enabling Permanent Use of Forest Resources
Related
"Popular Articles"
- Current Status of Renewable Energy in Japan (2015)
- Offshore Wind Farm Withstands Great East Japan Earthquake and Tsunami
- Current Status of Renewable Energy in Japan (2014)
- Geothermal Power: Japan Has World's Third Largest Geothermal Reserves, 60 Percent of Which Can Be Developed
- Tokyo Plans to Increase Renewable Energy Ratio to 20% by 2024
![]()

Some rights reserved. This work is licensed under a Creative Commons Attribution-NonCommercial-ShareAlike 3.0 License.